Silicon Chip Magazine

----------------------------------------------------------------------------------------------------------------------------------------------------
|          New Stuff          |          Features          |          Downloads          |          Purchase          |          Contact Me          |
----------------------------------------------------------------------------------------------------------------------------------------------------
Audio Spectrum Analyzer for the  Acoustic Specialist, Vibration Analyst, RF Engineer, or True Geek !

Fatpigdog's Real Time FFT Spectrum Analyzer

                    Excalibur             new

Spectrum Analyzer
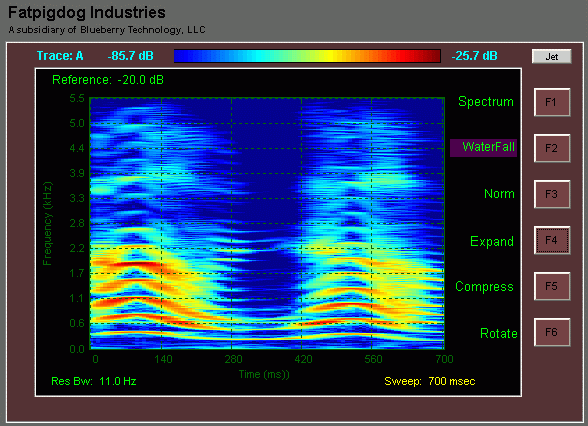
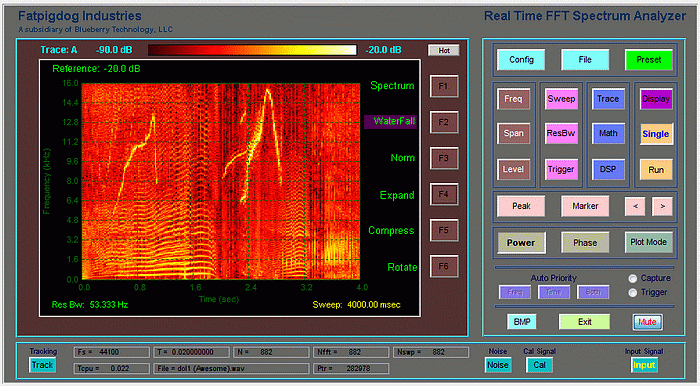
(Spectrogram of  a pod of Dolphins.)


Specifications (Click Here)

                                     * * *   BRAND NEW STUFF   * * *                          NEW
-------------------------------------------------------------------------------------

Faster Sweeps - Twice as fast as Ultra-Pro !

2 Channel Processing ( L & R Channels )

Digital Signal Processing (DSP) Functions ( L+R, L-R, Heterodyning ! )

Split Screen with Alternate Trace

Phase Analysis

Display Customization ( Background, Trace, Font, & Grid colors )

White Noise Generator

Selectable Resolution Priority (Time/ Frequency, Both)

User Defined Background Image

Save Trace Values as CSV File

Programmable Name Plate Text ( Your Name Here ! )

Guitar Tuner Mode

                                                     * * *   Brand New Menu Buttons   * * *                         New
-------------------------------------------------------------------------------------

Display
Math
DSP
Phase
Sig Gen Outputs
Resolution Priority
Grid (on/off)
Split Screen
Banner Name
Colors
Guitar Tune


Norm
Trace A + Trace B
Trace A - Trace B
Copy A to B
Hold Math Trace
Hide Math Trace


Left + Right
Left - Right
Left * Right
Left / Right
Left * Local Osc
Audio Monitor


Left vs. Local Osc
Left vs. Output
Left vs. Right
Squelch
Cal Tone
Tacking Gen
White Noise

Frequency
Time
Both


Download Files Here

Download Spectrum Analyzer Now !
After download, you will need the Registration Code.  Registration Code is provided upon payment.

Download Runtime Installer Here
If you've never installed this, you need to ... and its FREE !

Download User's Manual Here
The User's Manual goes into detail on all of the features, options, modes to help get you started.
Even some of the more well ... seasoned ... folks will appreciate built-in features here that Just Plain Don't Exist on their lab bench.

System Requirements !
Check to make sure you have these requirements satisfied .

Sounds (NEW !)
Make sure to checkout the wide variety of sounds (WAV files) available here FREE !!

Download SpectraGen FREE (NEW !)
Generate your own Image Spectrograms.  Get up and running Now, FREE !  Get the QuickStart Doc too!

ATTENTION Windows VISTA & Windows 7 Users !!!
To run this program successfully under Windows Vista or Windows 7, you must run the program as Administrator.  You can accomplish this by any of the following 3 choices:
Also  ..... 

ATTENTION 64 bit  Windows Users  !!!

To run this program under 64 bit versions of Windows, you must have the Microsoft Visual C++ 2005 32 bit redistributatble installed on your PC. Click Here to download the 2005, 32 bit VC++ redistributable from the Microsoft Download Center.


            - - - - - - - - - - -   Feature Summary  - - - - - - - - - - -      New


Logical Control Panel

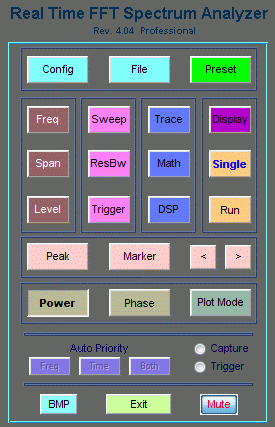
An updated Control Panel offers quick access to all of the functional modes of the Spectrum Analyzer through simple "pushbutton" controls.  New functions include Display, Math, DSP, Power and Phase.

Logical Grouping of related functions.

Functions just like Agilent or Tektronix Spectrum Analyzer.
Controls 405


Spectrum Plot - Detailed Display, with Soft Buttons

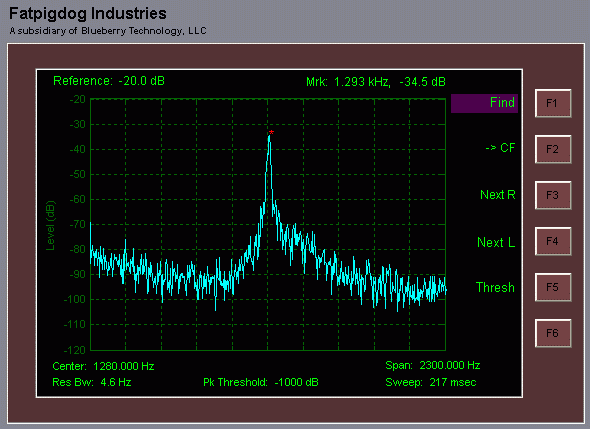
Screen annotation with important operating parameters including reference level, frequencies, markers,  and threshold. In this screen, the user has selected the Peak function.  On the screen you see the soft buttons for the Peak function.  Note the red marker sitting on the peak and the frequency and amplitude indicated in the upper screen annotation.

Spectrum Plot


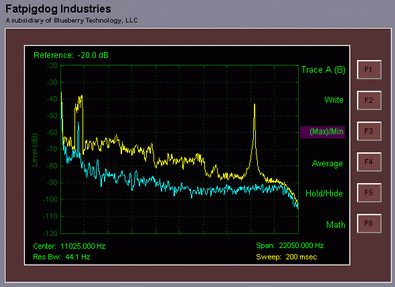
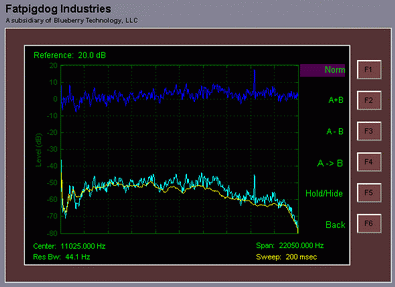
        Dual Trace                                                                                  Math Operations:
                  Trace A-Write,    Trace B-Max Hold                                Trace A-Write, Trace B-Average, Trace C-Normalization

Dual Trace, Max Hold on B      Tri-Trace, Normalization to Avg


Spectrogram Plot

Frequency - Time Plot, Now there's something you don't get on the traditional spectrum analyzers (ok, maybe you do get it if you pay enough).   This is great for displaying frequency histories, such as voice prints for example.

Voice Spectrogram


New
Split Screen: Waterfall - Spectrum
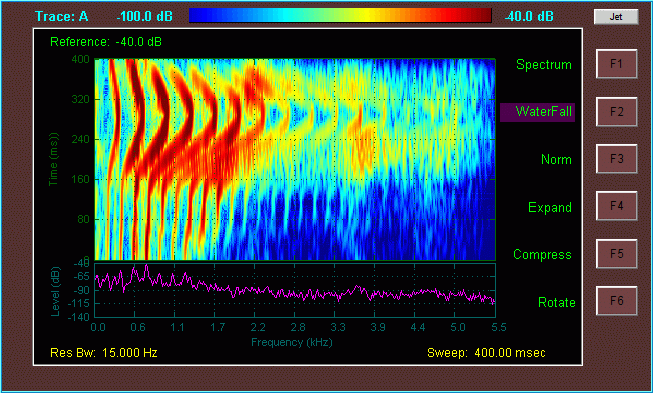
Get the best of both worlds:  Frequency - Time plot   AND   Power - Frequency plot.   Each plot has it's advantages, but no need to settle.  Get a visual of the time history and see the real time power spectral peaks at the same time.

Split Screen


New
Split Screen: Phase - Residual Carrier
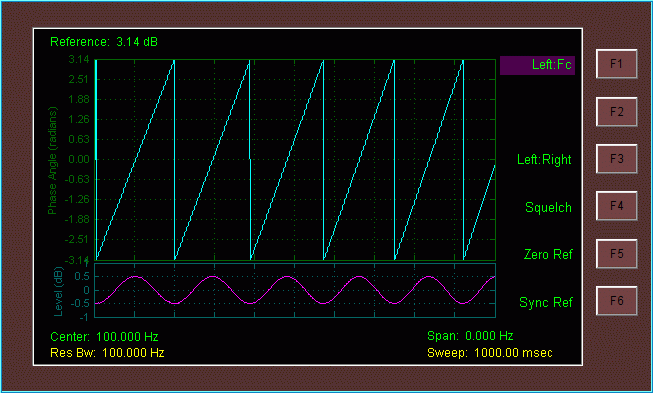
Excalibur adds Phase Analysis to the capabilities of the spectrum analyzer.  In this screenshot, the spectrum analyzer is put into Phase Analysis mode (Phase menu button) and Zero Span.  The input signal is a sinewave at 105 Hz.  The top plot shows the Phase of the input signal as a funtion of time.  The Phase is referenced to the internal reference oscillator tuned to the Center Frequency (Fc), 100 Hz.  The Split Screen plot displays the residual of the input signal after having been frequency shifted by Fc down to DC.   In this mode the user can compare an arbitrary input signal to a reference signal and get both a Phase-Time plot as well as a plot of the Down Converted input signal.   Useful in the analysis of frequency error, or investigation of a phase modulated signal.

SplitScreen Phase Test


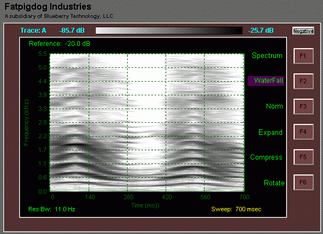
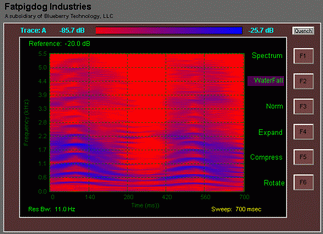
Custom Color Maps !!  Here is just a sampling:

Hot                                                                          Negative                                                                     Quench
Spectrogram with Hot Color Map  Spectrogram with Negative Color Map  Spectrogram with Quench Color Map


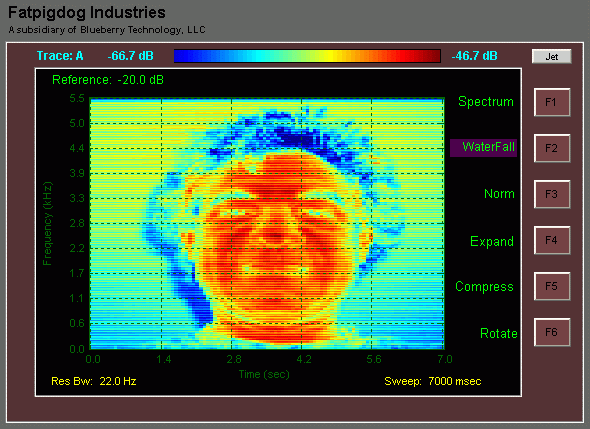
Spectrogram on Steroids !

This is what you can do with a spectrogram plot if your tricky.  Download this WAVE File and listen to it.  Then after you download the Real Time FFT Spectrum Analyzer, select the wave file as the input source to generate this Image Spectrogram. 

Want to generate your own Image Spectrograms?
Get SpectraGen FREE Now
Click Here

Spookey Spectrograph


New
Noise Generator - Need a source of nice, flat white noise.  Click the Noise menu botton and the spectrum analyzer will produce ... noise ... White Noise to be specific.  White Noise is signal content that has equal power density per Hz across the full range of the instrument.  Of course the frequency response of your sound system, including amplification, speakers, and microphone, will all contribute to modulate the spectal flatness of the measured response.  Great for a Quick Setup of a room, spectral holes and hotspots jump right out on the display!

Tracking Generator - Turning this on will make all sorts of cool chirp sounds as the Tracking Generator puts out a sweeping tone synchronized with the capture of the Spectrum Analyzer.  Handy for figuring out the frequency response of rooms, coffee cups, etc.

Calibration Tone - Just like the big boys, turning this on generates a tone at a programmable frequency.  Hint ... if you have a 16 year old daughter, set the tone to 16 kHz and turn up the volume.  It will drive her nuts !! (but don't do it when the wife is home, or you may be sleeping on the couch).

Input Selector - Select between real time audio input from microphone, line-in, or playback monitor OR select file input.  With file input, you browse around to your favorite .wav file.  Then as the analyzer sweeps, it plays and analyzes the .wav file.  If your handy with software, or you wait for me to write it, you can convert digitized RF to a wav file and analyze your captured RF signals on this very affordable, uber performance laden spectrum analyzer !!

Various Fields - These started out as debug fields, but I figured most of you Geeks out there would want to see this info as well (I use Geek most affectionately here).  Fs is the sample rate, T is the Sample interval for each sweep, N is the number of samples capture per sweep, Nfft is the number of samples that are FFT'd per sweep (Note that this number can be greater than N .... :-) , Nswp is the number of samples that are displayed per sweep (and this can be larger than N too), File is the file that you selected as the input source if you are running in FILE Input mode, Ptr is a block pointer into the input file, and FFT Overlap is an indicator light that says that we are taking FFTs over more samples than we capture per sweep.

Bottom


Fatpigdog's Real Time FFT Spectrum Analyzer - Excalibur

ONLY $49.95 + FREE Shipping

After Payment through the PayPal Check out page,  you will immediately receive a Registration Code for the:
Real Time FFT Spectrum Analyzer,  Excalibur Version

Half Price Discount Available (  Professors Take Note  ).
Purchase 5 or more licenses and pay only $24.98 each.


You Are Here !

HOME                            Other Cool web Pages

Fatpigdog

Contact me by EMAIL at:

(yes, there is a .1 in the email address !!!)

Fatpigdog & Blueberry Technology are brought to you by Spyro Gumas.
Everything here is Copyright Spyro Gumas, 2009-2019.  All Rights Reserved.


Sponsor Links:
DXZone
The DxZone


Visit SSS Online
Visit SSS Online!


Levitation Fun
Levitation Fun!